


Diwali is Over. How Is Your Indoor Air?
The lamps are packed away and the sweets are finished. The smoke is still around, though, and some of it is inside your office.
Every year, Diwali fireworks push outdoor PM2.5 in Indian cities to many times the WHO’s 24-hour guideline of 15 µg/m³. Most CRE teams treat that as an outdoor problem. Our sensor data from this Diwali shows it isn’t. Fine particles find their way through doors, gaps and fresh-air intakes, and they stay well after the last cracker.
For tech, financial services and consultancy firms in India, as people return to their desks after the holiday, it’s a good time to ask a simple question: what are your people breathing right now?
What our sensors saw in one Chennai office
On Diwali night, outdoor PM2.5 in Chennai was 364 µg/m³ in the 6-hourly reading, and the highest reading reached 657 µg/m³. That’s 24 to 44 times the WHO guideline. Indoor levels in a large technology office we monitor rose too, from almost nothing to a peak above 100 µg/m³.
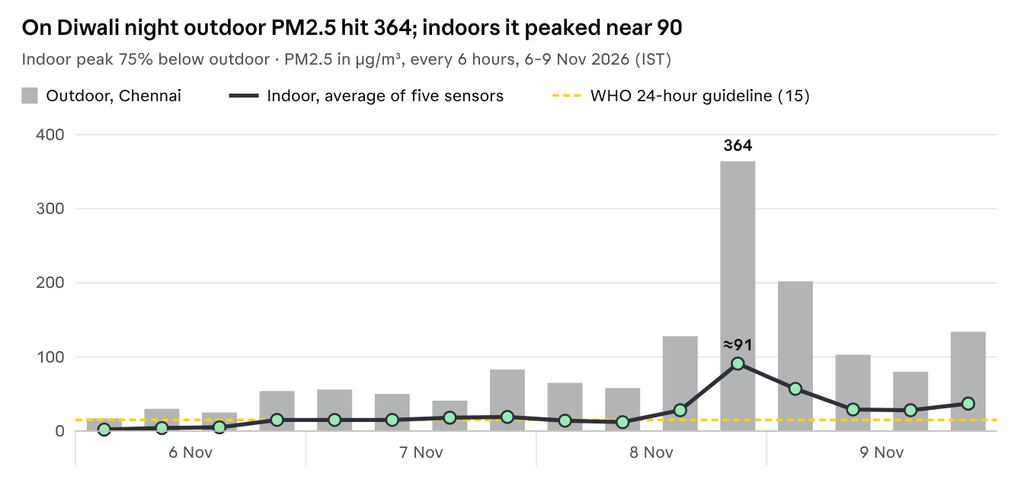
Outdoor: AQI.in, Chennai, 6-hourly. Indoor: average of five Rensair Cloud sensors, read from the sensor charts (approximate).
| Outdoor PM2.5 (µg/m³) | Indoor PM2.5, average of five sensors (µg/m³) | |
| 6 Nov, early morning | 17 | About 2 |
| 8 Nov, Diwali night | 364 (highest reading: 657) | About 90 (individual zones 60–115) |
| 9 Nov, morning | 202 | About 50 |
| 10 Nov | 86–123 | 25–45 |
Three things stand out:
- The building helped, but only so much. Indoor levels peaked about 75% below outdoor levels. That still meant a peak around six times the WHO guideline.
- Indoor followed outdoor. As the city’s air got worse from 6 November, the indoor average climbed above 15 µg/m³ and stayed there. Outdoor air was the main driver.
- The smoke doesn’t leave on its own. Outdoor PM2.5 stayed between 80 and 134 µg/m³ for days after Diwali. Without active cleaning, indoor air kept settling back to two or three times the guideline.
Indoor data: Rensair Cloud | Outdoor data: AQI.in, Chennai PM2.5.
Switch on, and the curve turns within minutes
The Rensair purifiers switched on at 09:30 on 9 November. Indoor PM2.5 began to fall in every zone straight away, while outdoor air was still above 100 µg/m³.
- Within minutes: every sensor’s reading turned downward. Before that, levels had been flat at around 50 µg/m³ all morning.
- Within the first hour: the cleanest zone fell from about 45 to about 25 µg/m³.
- By 14:30: all five zones were down to 15–22 µg/m³, close to the WHO guideline. One zone went from 50 to 16 µg/m³, a drop of about 70%.
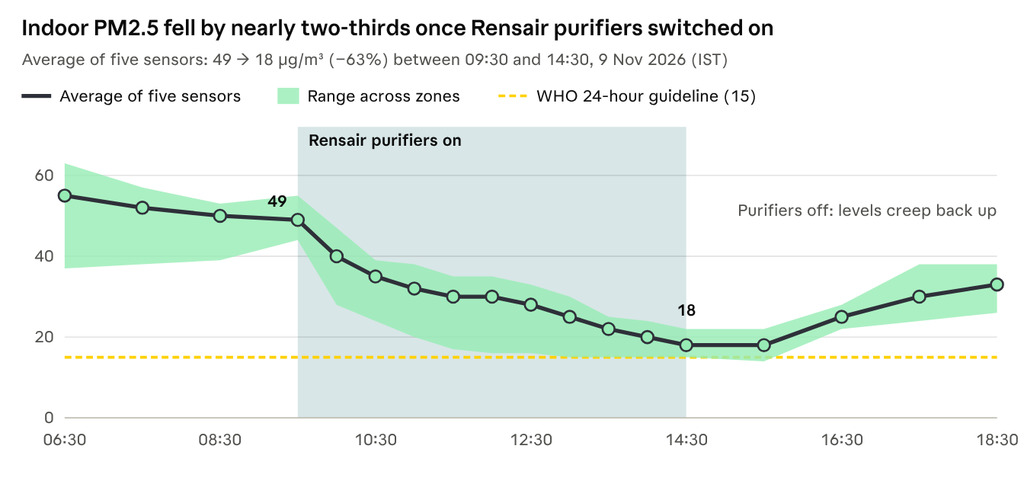
Five Rensair Cloud sensors, 9 Nov 2026, read from the sensor charts (approximate).
All five zones followed the same pattern, so this wasn’t one well-placed unit. The whole floor cleared together.
Units off vs units on, compared with outdoor air
With the units running, indoor air was at least 78–85% below outdoor and close to the WHO guideline. On Diwali night, with the units off, the building alone kept indoor air 75–86% below outdoor, but that still left it six times over the guideline.
| Outdoor PM2.5 (µg/m³) | Indoor PM2.5 (µg/m³) | Indoor below outdoor | |
| Diwali night, 8 Nov, units off | 364 (6-hourly reading) to 657 (highest reading) | About 91, average of five sensors | 75–86% |
| 9 Nov, 14:30, after 5 hours with units on | Above 100 | 15–22 across all five zones | At least 78–85% |
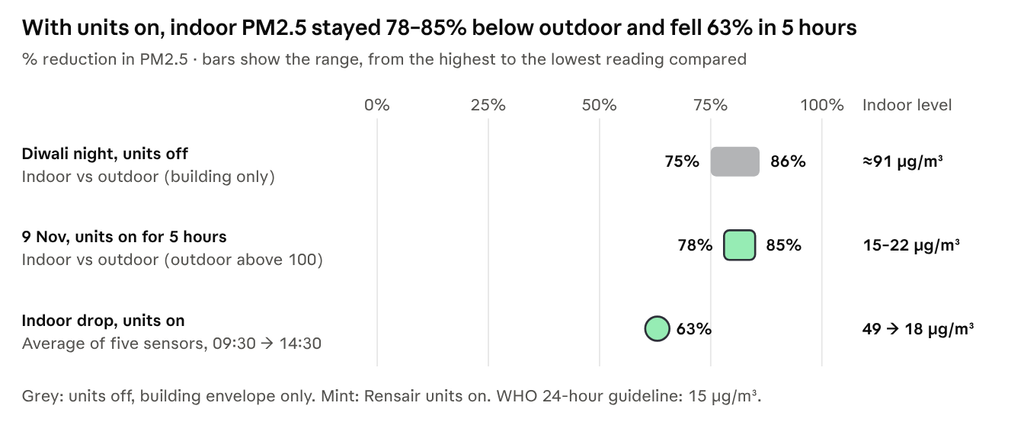
Outdoor: AQI.in, Chennai (6-hourly reading 364; highest reading 657). Indoor: five Rensair Cloud sensors, read from sensor charts (approximate).
The percentages look similar. The levels behind them don’t: indoor air went from about 91 µg/m³ to 15–22 µg/m³. Inside the office, the units cut the average reading by 63%, from 49 to 18 µg/m³.
The data also showed what happens when you stop. Once the purifiers switched off that afternoon, outdoor air kept seeping in. By midnight, indoor PM2.5 was back at 35–40 µg/m³. The same thing happened on 10 November.
The point is simple: during a pollution event, clean air depends on cleaning that runs when it’s needed, not on a fixed schedule. That’s the idea behind Smart Demand Controlled Ventilation (SDCV).
Cleaner air that also cuts your energy bill
When outdoor air is this polluted, pulling in more of it isn’t the answer. Rensair’s Smart Demand Controlled Ventilation (SDCV) can cut building energy use by more than 40%.
The usual way to improve indoor air is to bring in more fresh air through the HVAC. In India, that air then has to be cooled and dehumidified, which takes a lot of energy. During Diwali or the winter smog season, it can also bring in the very pollution you’re trying to keep out.
SDCV cleans the air that’s already inside instead:
- Purify, don’t over-ventilate. Hospital-grade HEPA and UVC purifiers clean room air, so less outdoor air needs conditioning. Rensair says this uses about nine times less energy per cubic metre of air than a conventional HVAC system.
- Respond to real conditions. Sensors feed Rensair Cloud with live data, and devices react when pollutants cross a threshold you set. Rensair Cloud can also link to your BMS.
- Measurable savings. At University College Cork, SDCV cut energy use by 47% and CO₂e emissions by 45% over 12 months. Typical payback is one to three years.
For occupiers, that supports ESG and net-zero commitments. For owners, it makes a building more attractive to tenants who now ask about indoor air quality.
Recognised by the corporate real estate community
Rensair won the CoreNet Global Innovators Award 2026 for SDCV. CoreNet Global is the leading association for corporate real estate professionals. This recognition comes from the people who manage the world’s office portfolios, and it shows that healthy air and lower energy use can go together.
What to do before the next pollution season
Diwali is only the start. North India’s winter smog and South India’s post-monsoon haze come next. Here are three steps for CRE owners and occupiers:
Measure. Compare. Clean.
See it in your own building. Book a site visit, and our team will assess your space and show you what Rensair Cloud and SDCV could do for your people and your energy bill.